1. First look at Fermi LAT photon files with ftlist and fv
Event files like L1309081333300B976F4377_PH00.fits are FITS files. FITS is the standard data format in astronomy for arrays (e.g. 2D images) and tables (e.g. source catalogs or event lists).
Let’s use a few different tools to explore the content of L1309081333300B976F4377_PH00.fits.
1.1. List photon file contents with ftlist
ftlist is a command-line tool to ... duh ... list the content of FITS files. A FITS file consists of header-data units (HDUs), where each HDU is an array or table. For historic reasons the first HDU (a.k.a. primary HDU) has to be an array, so in FITS files that only contain tabular data the primary HDU will be a dummy, empty HDU.
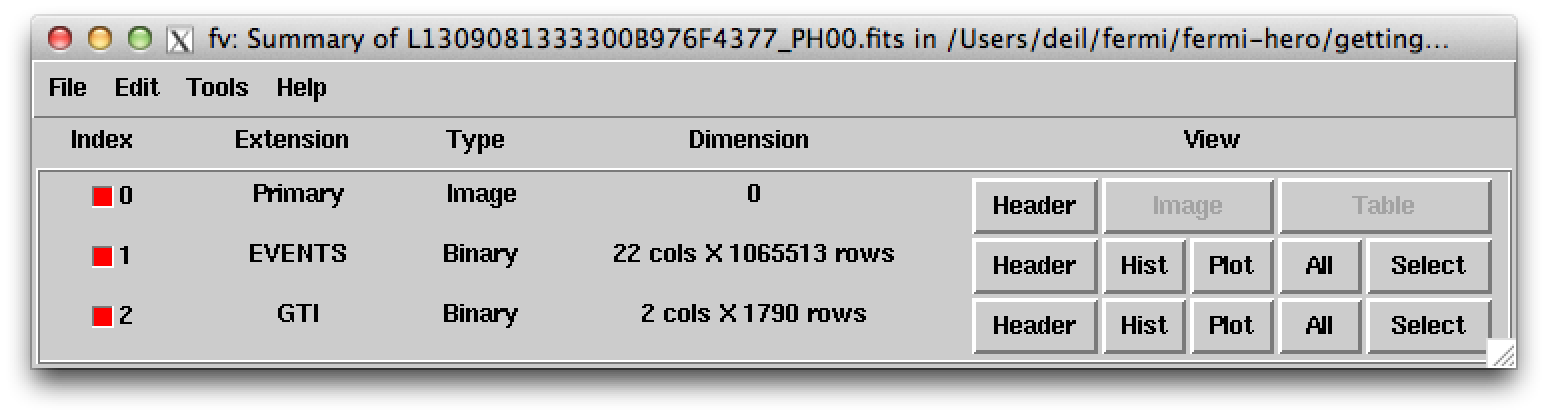
Giving a filename and the print option H to list a 1-line summary of the HDUs to ftlist we get:
$ ftlist L1309081333300B976F4377_PH00.fits H

        Name               Type       Dimensions
        ----               ----       ----------
HDU 1   Primary Array      Null Array
HDU 2   EVENTS             BinTable    22 cols x 1065513 rows
HDU 3   GTI                BinTable     2 cols x 1790 rows
So this event file contains an EVENTS table with 1065513 events and a GTI (good time interval) table with 1790 GTIs. GTIs are needed to compute exposure. Exposure is needed to compute the flux of sources.
To list the names and units of the columns in the EVENTS and GTI table use the C print option with ftlist:
$ ftlist L1309081333300B976F4377_PH00.fits C
HDU 2

  Col  Name             Format[Units](Range)      Comment
    1 ENERGY             E [MeV] (0.:10000000.)
    2 RA                 E [deg] (0.:360.)
    3 DEC                E [deg] (-90.:90.)
    4 L                  E [deg] (0.:360.)
    5 B                  E [deg] (-90.:90.)
    6 THETA              E [deg] (0.:180.)
    7 PHI                E [deg] (0.:360.)
    8 ZENITH_ANGLE       E [deg] (0.:180.)
    9 EARTH_AZIMUTH_ANGLE E [deg] (0.:360.)
   10 TIME               D [s] (0.:10000000000.)
   11 EVENT_ID           J (0:2147483647)
   12 RUN_ID             J (0:2147483647)
   13 RECON_VERSION      I (0:32767)
   14 CALIB_VERSION      3I
   15 EVENT_CLASS        J (0:32767)
   16 CONVERSION_TYPE    I (0:32767)
   17 LIVETIME           D [s] (0.:10000000000.)
   18 DIFRSP0            E (0.:1.0E+38)
   19 DIFRSP1            E (0.:1.0E+38)
   20 DIFRSP2            E (0.:1.0E+38)
   21 DIFRSP3            E (0.:1.0E+38)
   22 DIFRSP4            E (0.:1.0E+38)

HDU 3

  Col  Name             Format[Units](Range)      Comment
    1 START              D [s] (0.:10000000000.)
    2 STOP               D [s] (0.:10000000000.)
To print the content of the EVENTS table extension give the extension name in square brackets after the filename use the T print option with ftlist:
$ ftlist L1309081333300B976F4377_PH00.fits[EVENTS] T rows=1-10 columns=ENERGY,RA,DEC,TIME

            ENERGY             RA            DEC                    TIME
               MeV            deg            deg                       s
  1        398.907        94.0848        5.88669        378713295.231454
  2        425.700        91.8646        7.99151        378724463.542101
  3        262.569        93.0315        4.90930        378724578.466829
  4        683.413        90.3001        3.16895        378725356.681894
  5        889.776        90.3241        7.67446        378725486.282723
  6        566.726        90.3723        7.70085        378719151.132736
  7        305.036        91.6181        6.04271        378719248.977633
  8        140.088        94.2944        5.68424        378736517.165258
  9        184.310        91.1134        4.95412        378736587.650162
 10        138.277        92.4515        5.60271        378742238.959606
ftlist is just one of many command line tools to work with FITS files, called the FTOOLS, which you get as part of a package called HEASOFT.
You should know that for each FTOOL you can get the help page locally quickly by using fhelp <tool name>:
$ fhelp ftlist
Sometimes this will open up the help page in the terminal, sometimes in HTML format in your web browser.
To quickly see list the parameters of a given FTOOL use plist:
$ plist ftlist
Parameters for /Users/deil/pfiles/ftlist.par
       infile = L1309081333300B976F4377_PH00.fits[EVENTS] Input file name
       option = T                Print options: H C K I T
     (outfile = -)               Optional output file
     (clobber = No)              Overwrite existing output file?
     (include = *)               Include keywords list
     (exclude = )                Exclude keywords list
     (section = *)               Image section to print, eg, '2:8,1:10'
     (columns = *)               Table columns to print
        (rows = -)               Table rows or ranges to print, eg, '2,6-8'
      (vector = -)               Vector range to print, eg, '1-5'
   (separator =  )               Column separator string
      (rownum = Yes)             Print row number?
   (colheader = Yes)             Print column header?
        (mode = ql)              Mode
You see the parameter name, last or default value and a short description. There are required parameters (the ones without parentheses) that you will be quoted for interactively if not given on the command line. And there are optional parameters (the ones in parentheses) that you have to give on the command line if you want to choose a different value than the default.
1.2. Plot a photon zenith angle histogram with fv
Next let’s use Fv: The Interactive FITS File Editor. ftlist was a command line tool ... fv is a GUI (graphical user interface) tool.
Open fv and the event file like this:
$ fv L1309081333300B976F4377_PH00.fits
or if you prefer to run fv in the background like this:
$ fv L1309081333300B976F4377_PH00.fits &
The advantage of running tools in the background is that you can execute other commands without having to wait for the tool to finish or having to open an extra terminal window.
fv is very powerful, but because it’s so ugly that it probably makes your eyes hurt we’ll only use it to do one thing: plot a the distribution of the ZENITH_ANGLE of the EVENTS.
- Click the Histogram button for the EVENTS HDU.
- In the dialog window called Histogram select ZENITH_ANGLE as column name for X. In this case the default binning options are reasonable ... click Make/Close.
- Done. A window called POW shows the zenith angle histogram.
- In the fv menu click Quit, then No to All in the exit dialog window to confirm that you don’t want to permanently save the temp histogram file.
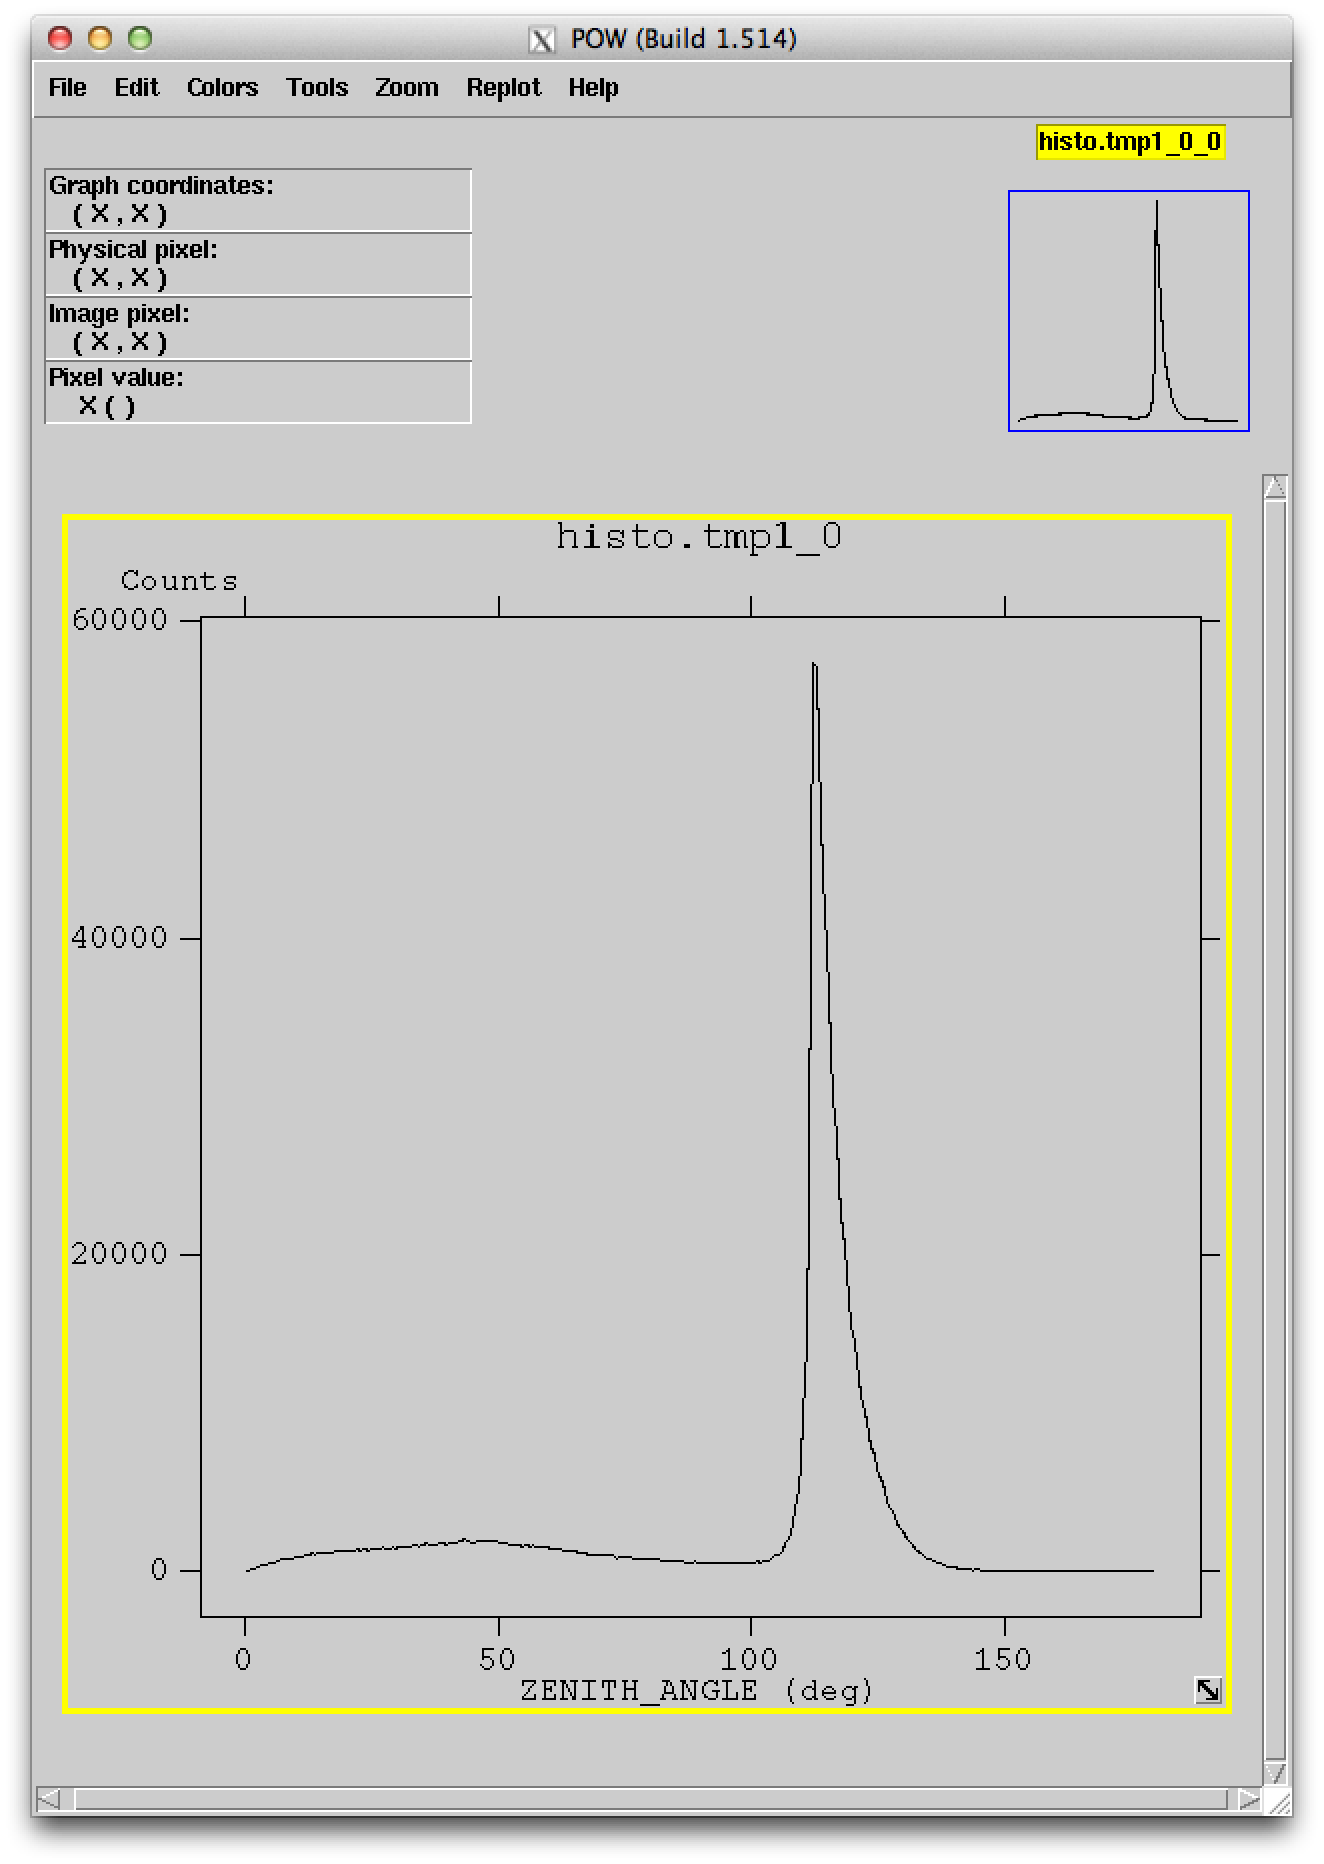
The zenith angle histogram shows a broad peak in the range 0 deg to 100 deg, and a narrow peak around 113 deg.
We’ll explain the origin and relevance of this distribution in the next section Prepare Fermi LAT data with gtselect and gtmktime.