5. Explore Fermi LAT photon data with TOPCAT
Now that we have a prepared the event list to only contain astrophysical photons let’s have a look at the (RA, DEC), (L, B) as well as ENERGY and TIME distributions of the events.
5.1. TOPCAT
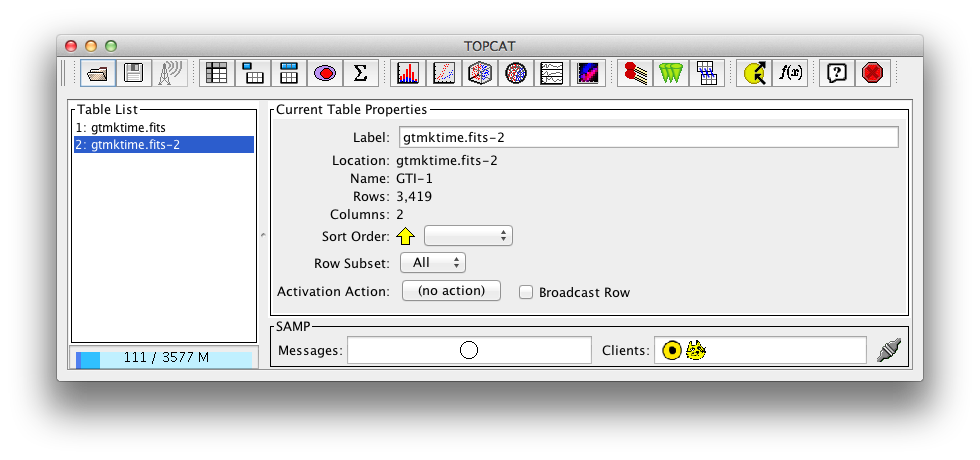
TOPCAT is the “Tool for OPerations on Catalogues And Tables”. Open the preprocessed event list with will open the main window with TOPCAT in the title and by default select the GTI HDU (called location gtmktime.fits-2 and name GTI-1):
$ topcat gtmktime.fits
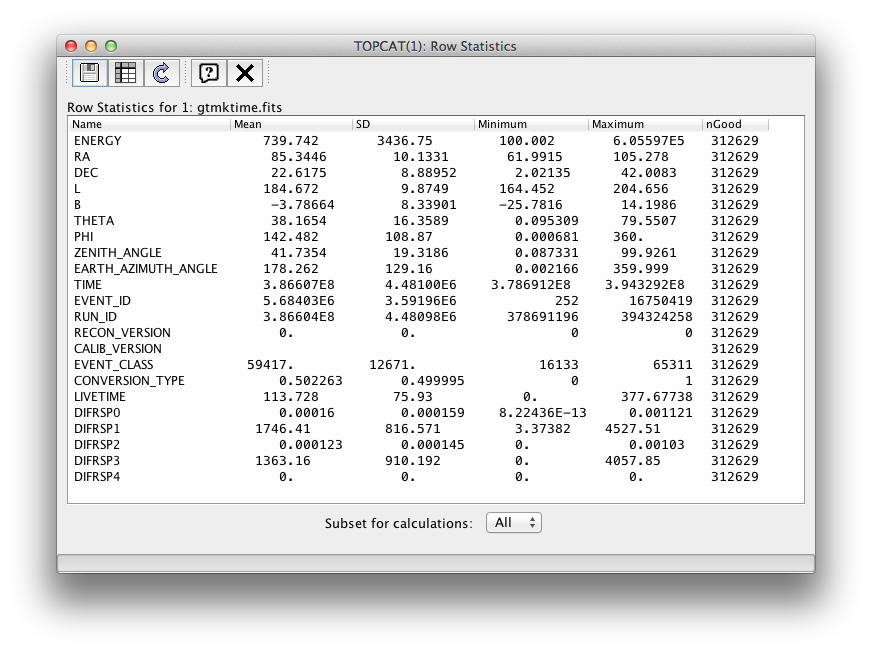
- In the table list on the left side of the main window, select the first HDU. You should see Name: EVENTS-1 in the Current Table Properties section.
- Open the Row Statistics window by clicking the button with the upper-case greek sigma.
Using TOPCAT is quite easy and it has a good manual, so we will not give detailed instructions how to make the following plots ... with some trial and error you should be able to figure it out yourself.
5.2. Spatial distribution
TODO: explain sources and diffuse emission and PSF Point to Make an image with gtbin and view it with ds9 tutorial and Galactic Center High-Energy View tutorial.
5.3. Energy distribution
Try to create the following histogram to look at the energy distribution:
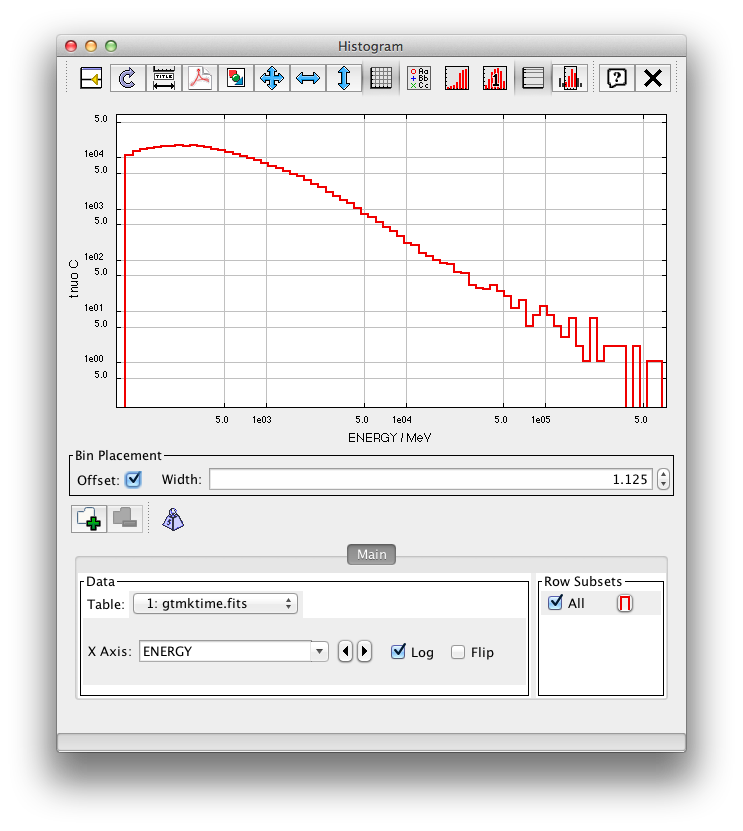
TODO: explain shape: source power-law spectra and Fermi-LAT effective area. Point to Spectrum tutorial.
5.4. Time distribution
Next try to create the following histogram to look at the time distribution (which is proportional to the event rate since we use equal-width time bins).
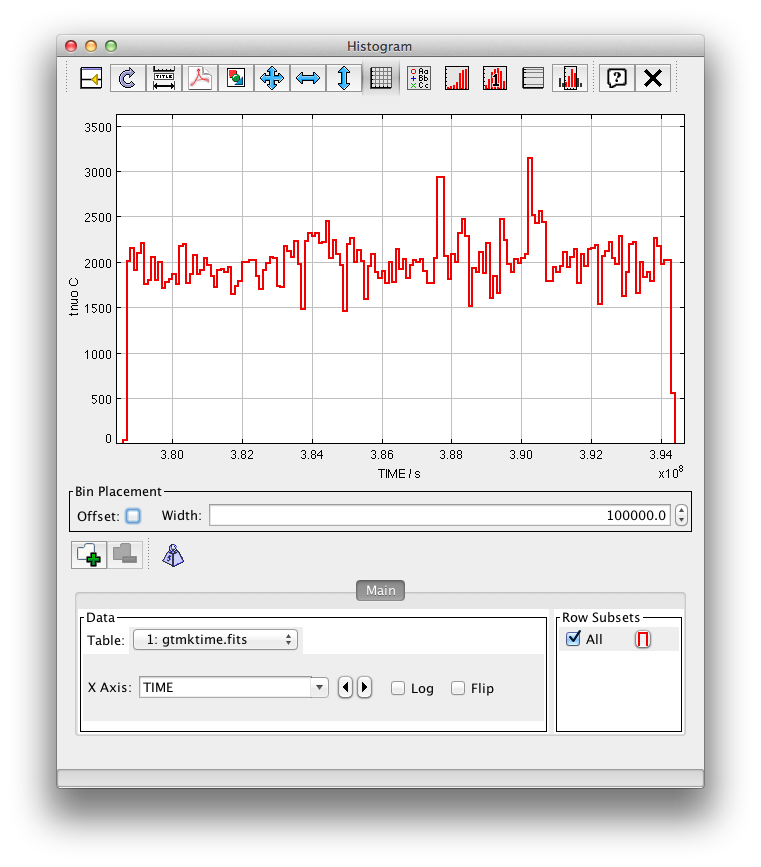
TODO: explain shape via obs strategy and IRF (and possibly source variability). Point to Aperture Lightcurve tutorial.